No items found.
No items found.

Surveys are essential in business because they provide direct insights from customers, employees, and other stakeholders, enabling informed decision-making. They can help improve products and services, enhance customer satisfaction, boost employee morale, understand market trends, and assist in benchmarking performance.
However, conducting surveys and gathering survey results are just one part of the process. Presenting the survey report in an easy and understandable manner is crucial to helping stakeholders make informed decisions.
In this article, we will look into the step-by-step process of turning your survey data into a compelling, informative presentation.
Showcasing survey results with presentations is crucial for effectively communicating insights to stakeholders. Various surveys serve different purposes. For example, a product survey can inform the product team about which features customers like or dislike, enabling modifications to suit their target audience better.
However, not all stakeholders have the time or expertise to analyze each survey response and draw conclusions. In such scenarios, survey result presentations are the most appropriate tool to summarize findings in a digestible and engaging manner.
Effective presentation of survey results is essential for several reasons:
Clarity: Clear presentations help audiences quickly and accurately understand the findings.
Engagement: Engaging presentations keep the audience interested and focused.
Decision-making: Well-presented data supports informed decision-making.
Credibility: Professional presentations enhance the credibility of the data and the organization.
By summarizing complex survey data into concise, visual, and well-structured presentations, businesses can ensure that the insights gained are accessible and actionable for all stakeholders.
We have now seen that when you present your survey results clearly and effectively, it will directly contribute to organizational growth. Let's explore the essential steps and best practices for creating an impressive and impactful survey result presentation.
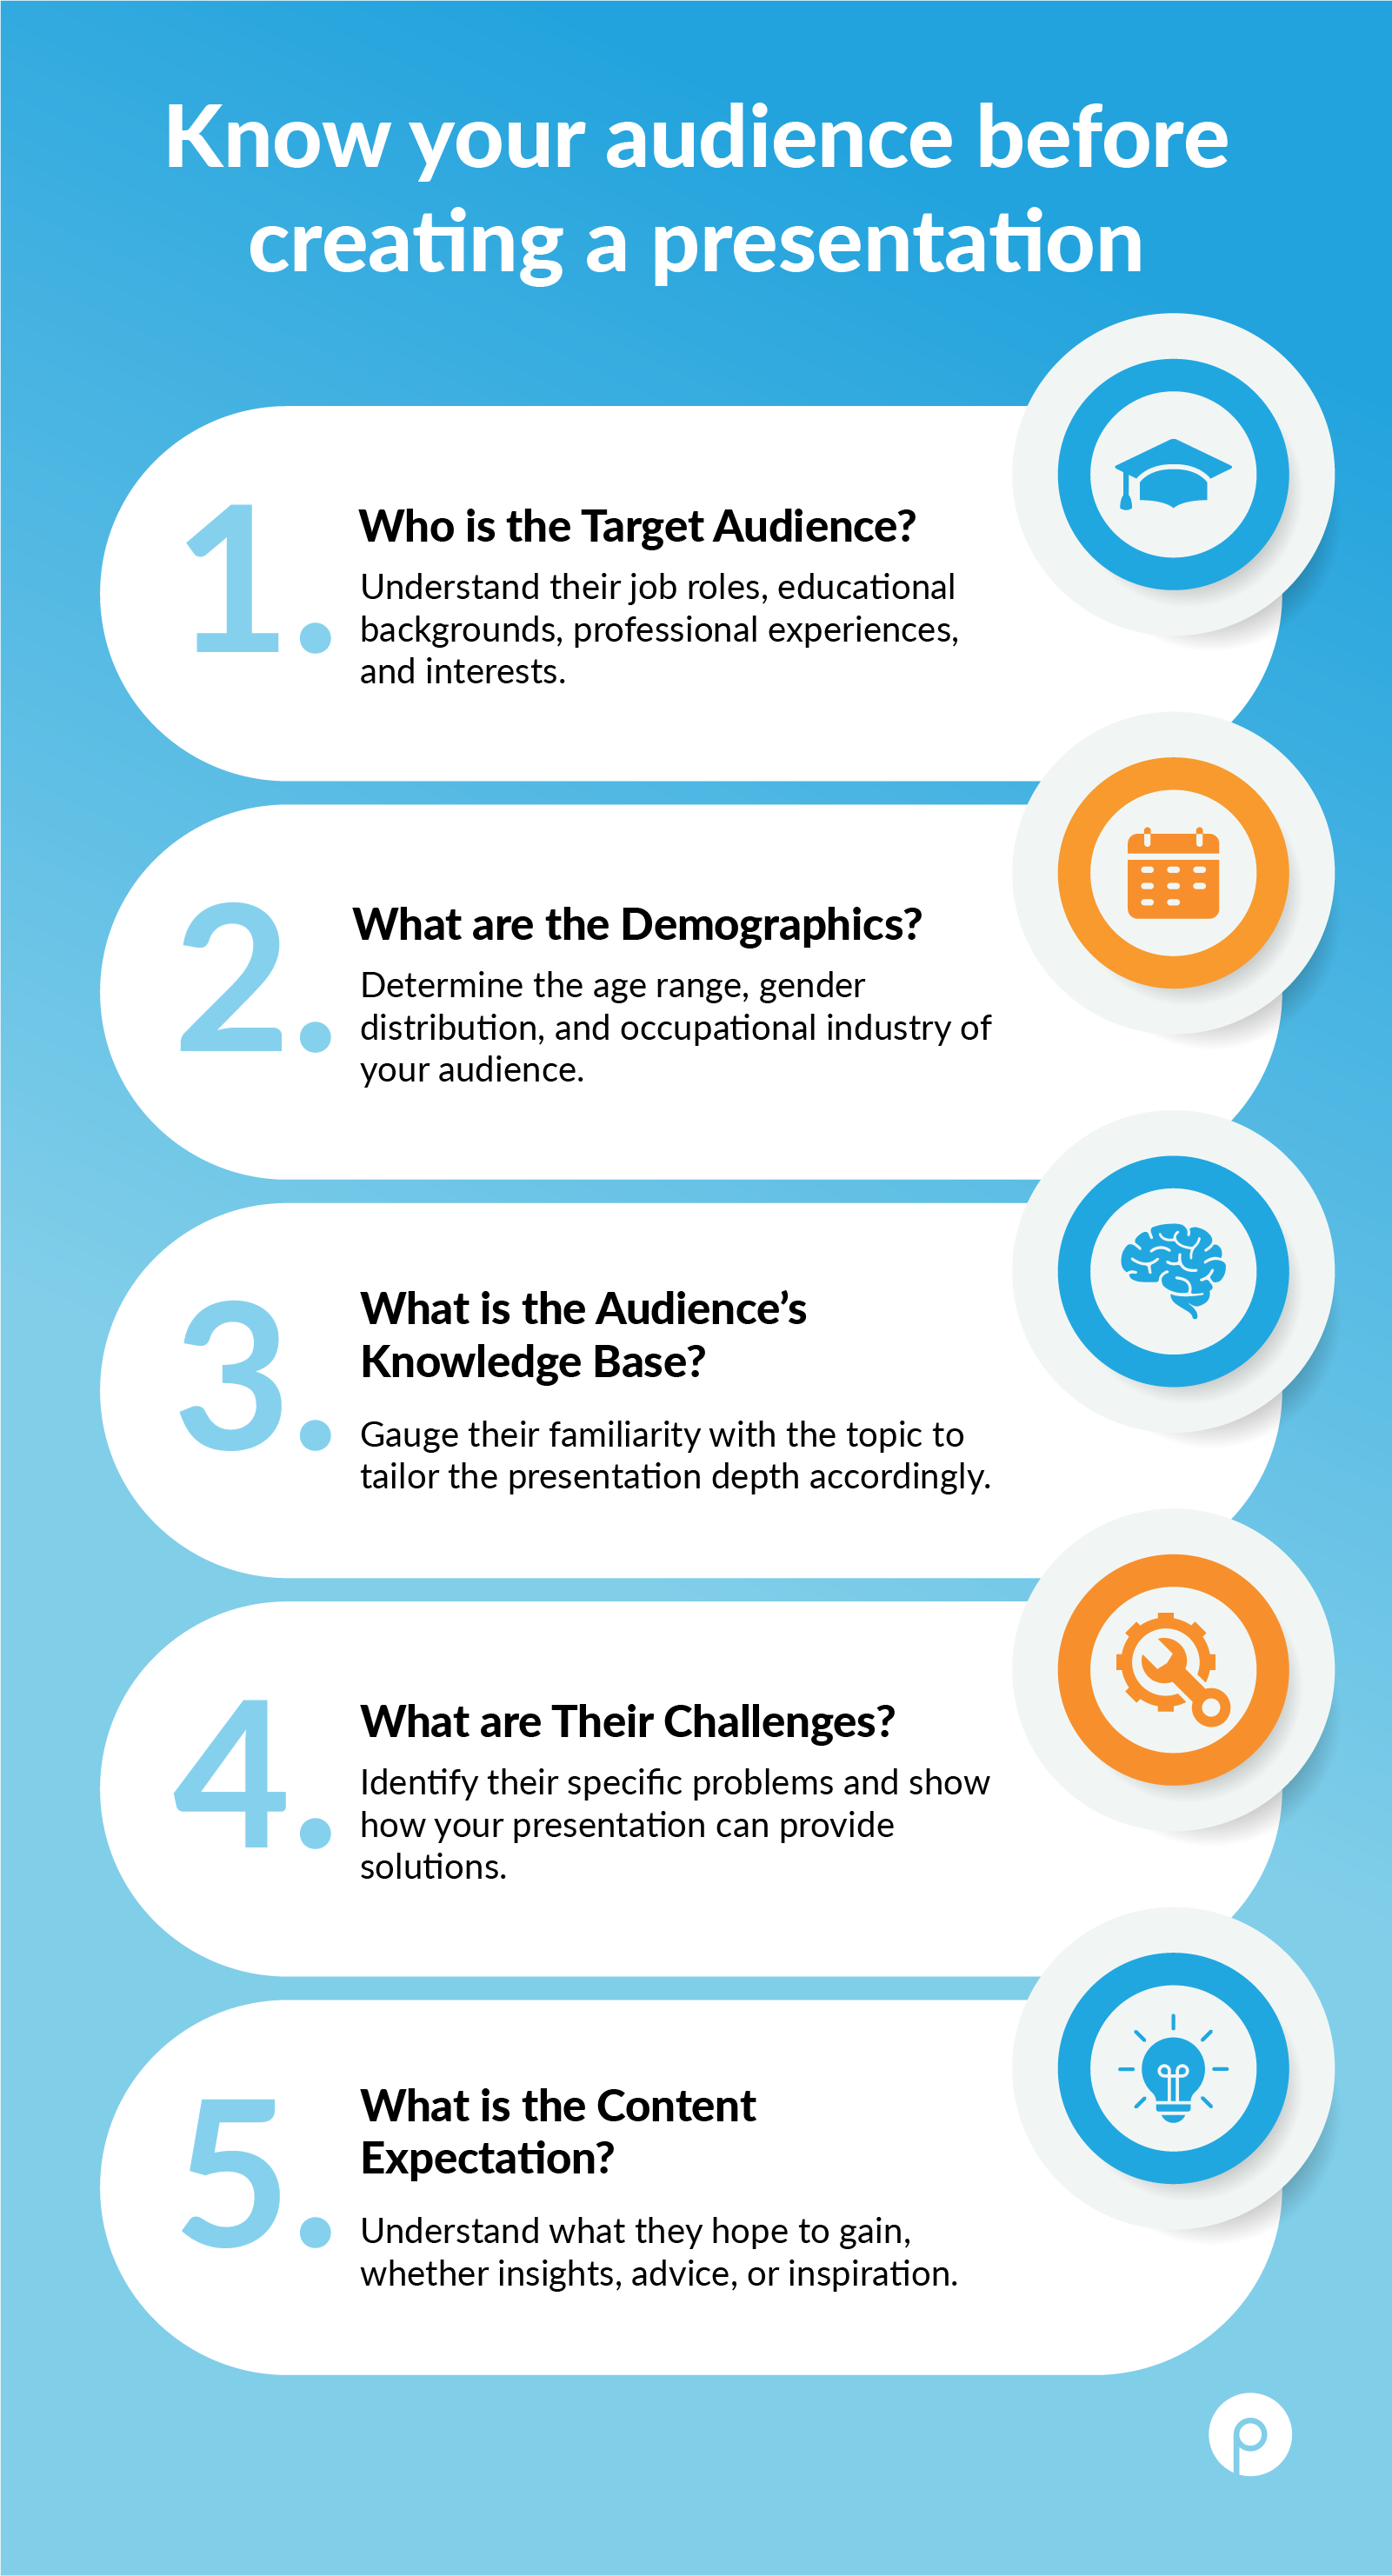
Understanding the audience is the first step in effectively presenting your survey results. Knowing your audience helps you filter through the extensive data to select only the parts that are most relevant to them.
Since not all data will apply to every audience, consider the following questions before starting your presentation
Who is your audience?
Identify their roles, educational backgrounds, professional experiences, and interests. Consider their demographics, values, strong opinions, and cultural factors to tailor your message effectively.
What do they need to know?
Focus on data that addresses their specific concerns, challenges, and goals. Prioritize information that aligns with their values and helps solve their pain points. Use the type of data and evidence that resonates most with them, whether statistical or anecdotal.
How will they use the information?
Tailor your presentation to support their decision-making processes. Understand their preferred communication styles and the context in which they operate. For mixed audiences, identify key decision-makers and adapt your approach to ensure clarity and engagement for all attendees.
When presenting your data, it's crucial to focus on the most impactful findings for your audience. This involves selectively analyzing and presenting data that provides valuable insights and supports your narrative. The following approach will help you in your data selection and presentation:
1- Answers key questions:
Ask these three questions to identify the relevant data set.
2- Highlights trends and patterns:
Look for notable trends or patterns in the data that reveal significant insights for the audience.
For example, suppose a large percentage of respondents prefer a particular feature of your product. In that case, this becomes an excellent insight for the product team to focus on and improve for the customers.
3- Supports your conclusions:
Presenting data and insights as they are won't strongly support your suggestions. Present your data in a way that logically leads to your conclusions. Start with the raw data, move through analysis, and end with clear, supported findings.
Ensure the data you present directly backs up your conclusions and recommendations, highlighting how specific data points and trends reinforce your main messages. By structuring your data presentation logically, you make a stronger, more persuasive case for your conclusions and recommendations.
A compelling storyline helps convey survey results more effectively by making the presentation engaging and easy to follow. Therefore, structure your presentation with a clear beginning, middle, and end:
The start of a presentation plays an important role in capturing the audience's attention and building the foundation for a successful presentation. Provide background information on why the survey was conducted and explain the problem or question that prompted the study. Articulating the survey's objectives clearly sets expectations for your audience and provides a framework for the data you will present.
Highlight the most important and relevant data from the survey. Use charts, graphs, and other visual aids to make these points clear and impactful. Go beyond just presenting the data. Explain what the numbers mean and why they are significant. Discuss any trends, patterns, or notable insights from the data.
You can incorporate examples and quotes from the survey responses to add depth and context to your findings. This helps to humanize the data and makes it more relatable.
There are various ways to end your presentation. Some of the ways that you can use to end your presentation constructively are:
Surveys can reveal valuable trends and feedback that might otherwise be overlooked. Quantitative data makes patterns visibly clear and facilitates stakeholder decision-making when presented effectively through data visualization. Therefore, selecting an appropriate chart format is crucial for the effectiveness of your presentation.
Choosing the right type of charts and graphs facilitates understanding the story your data points are communicating. Below are some popular types of graphs and charts you can use to showcase your survey results:
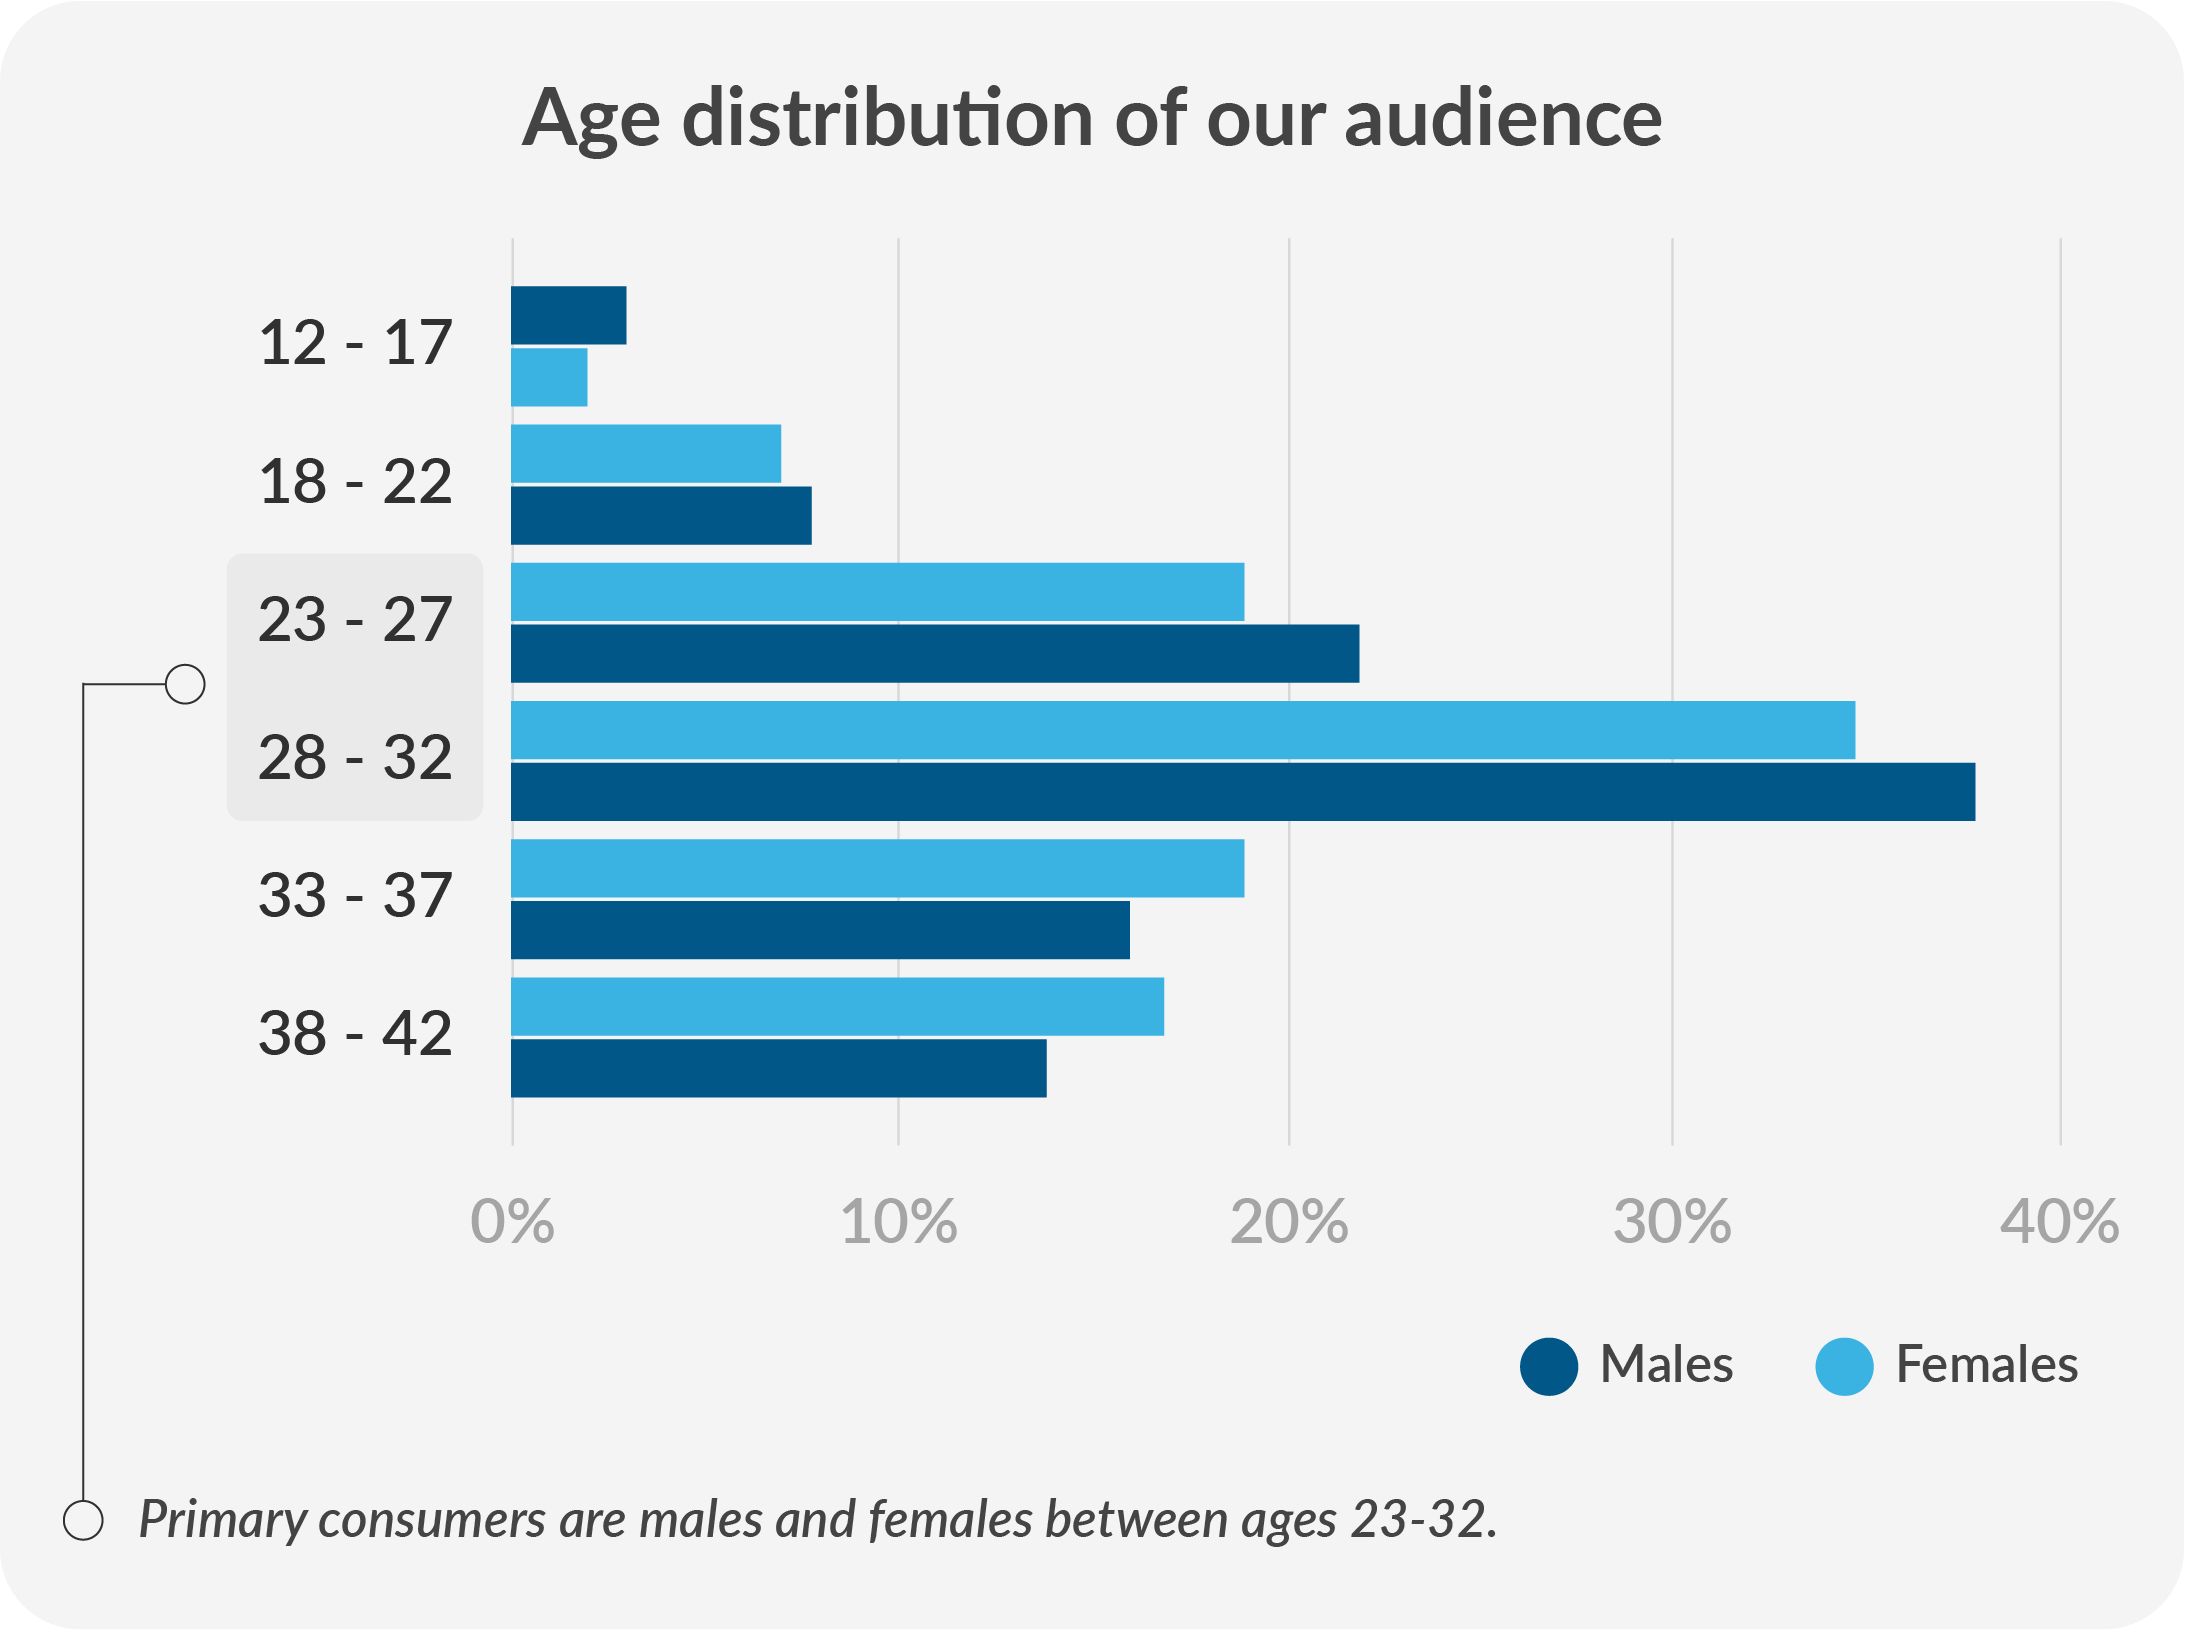
Here are a few examples of survey results presented with data visuals:
A- Data representing the age of primary consumers with bar graph:
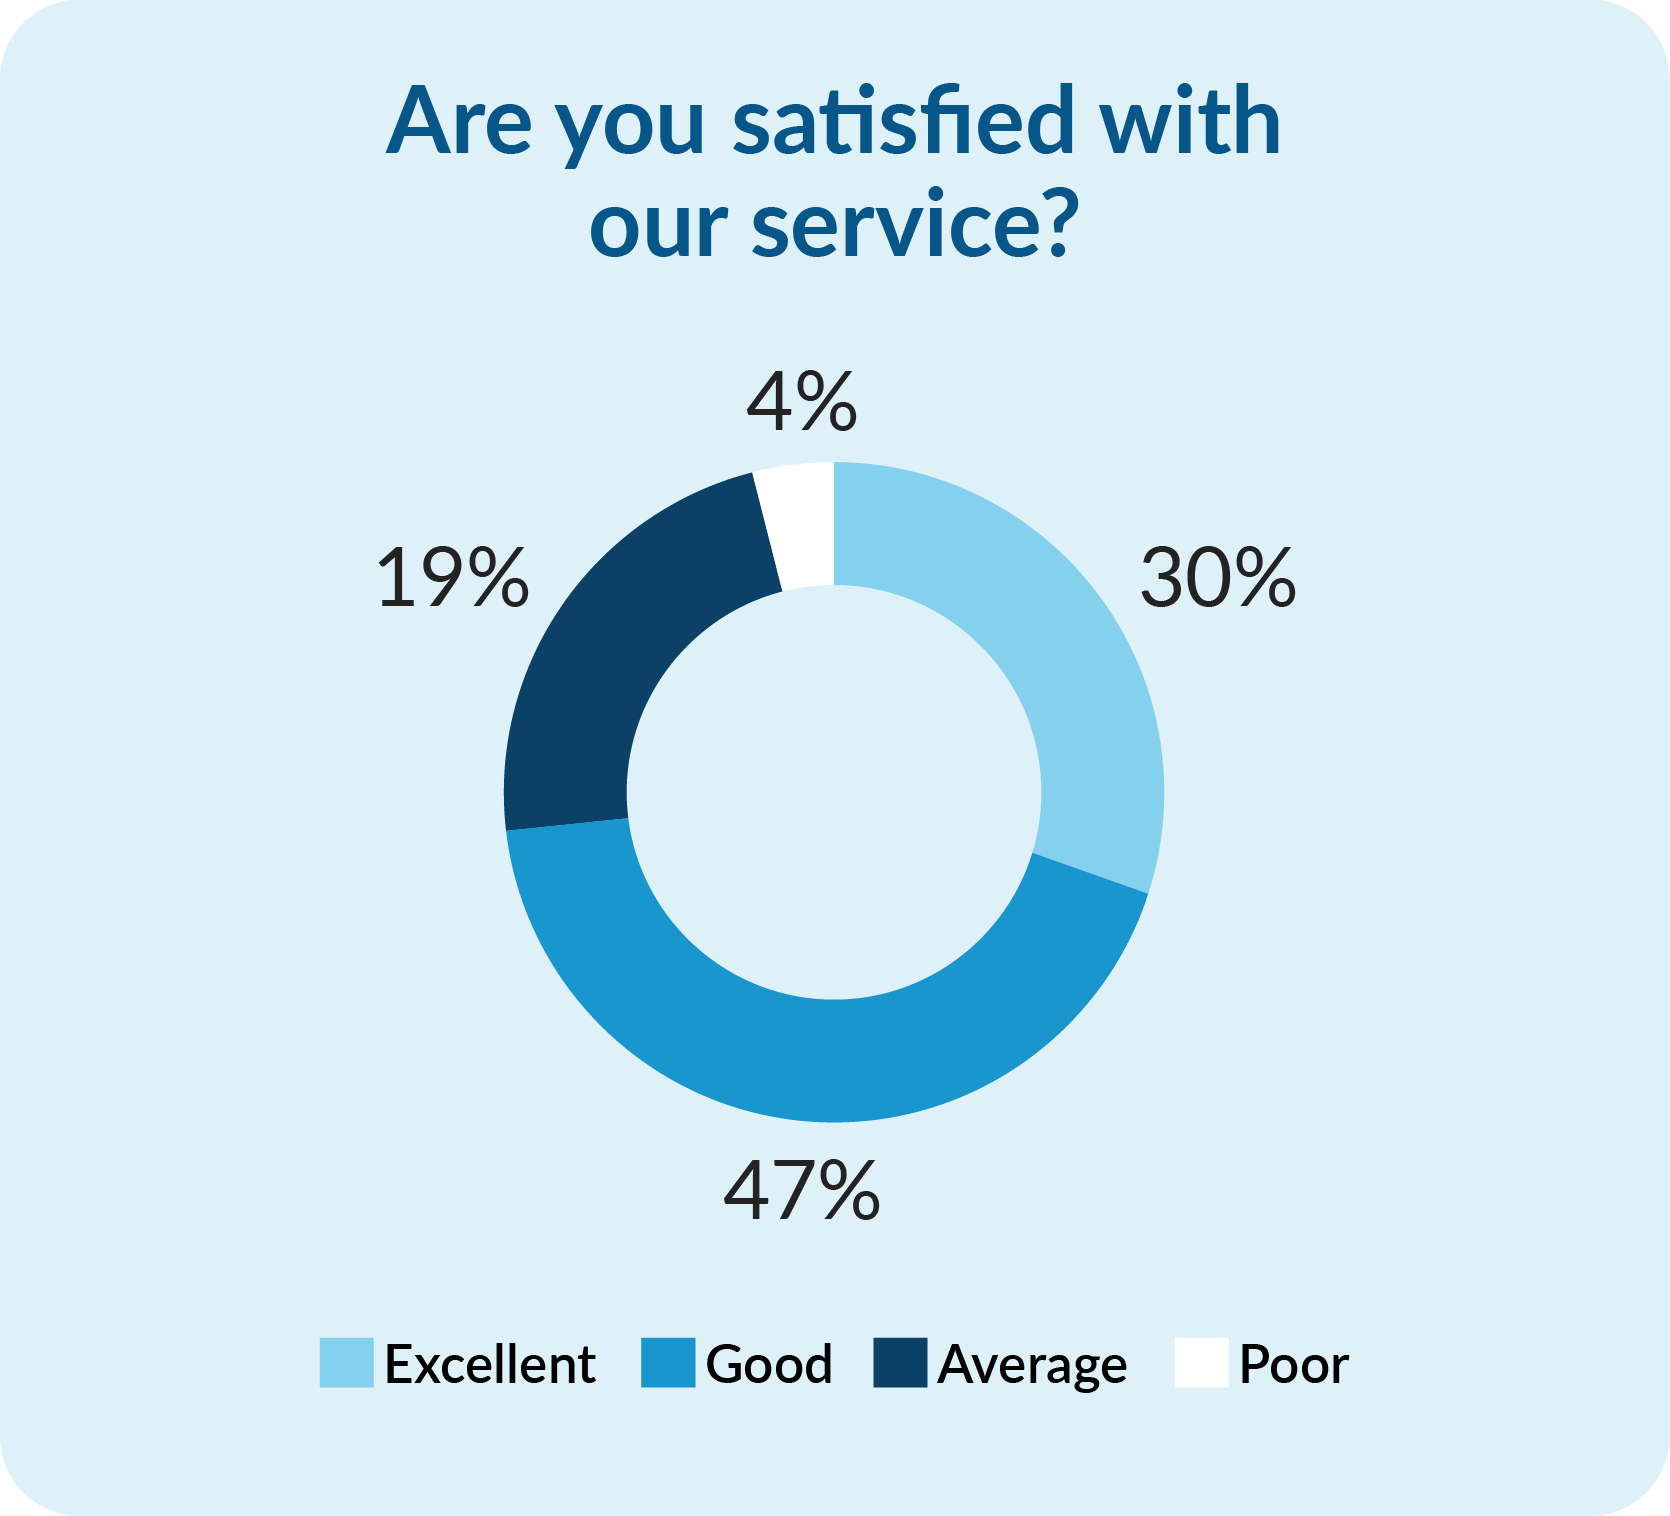
B- Data representing customer satisfaction with donut diagram:
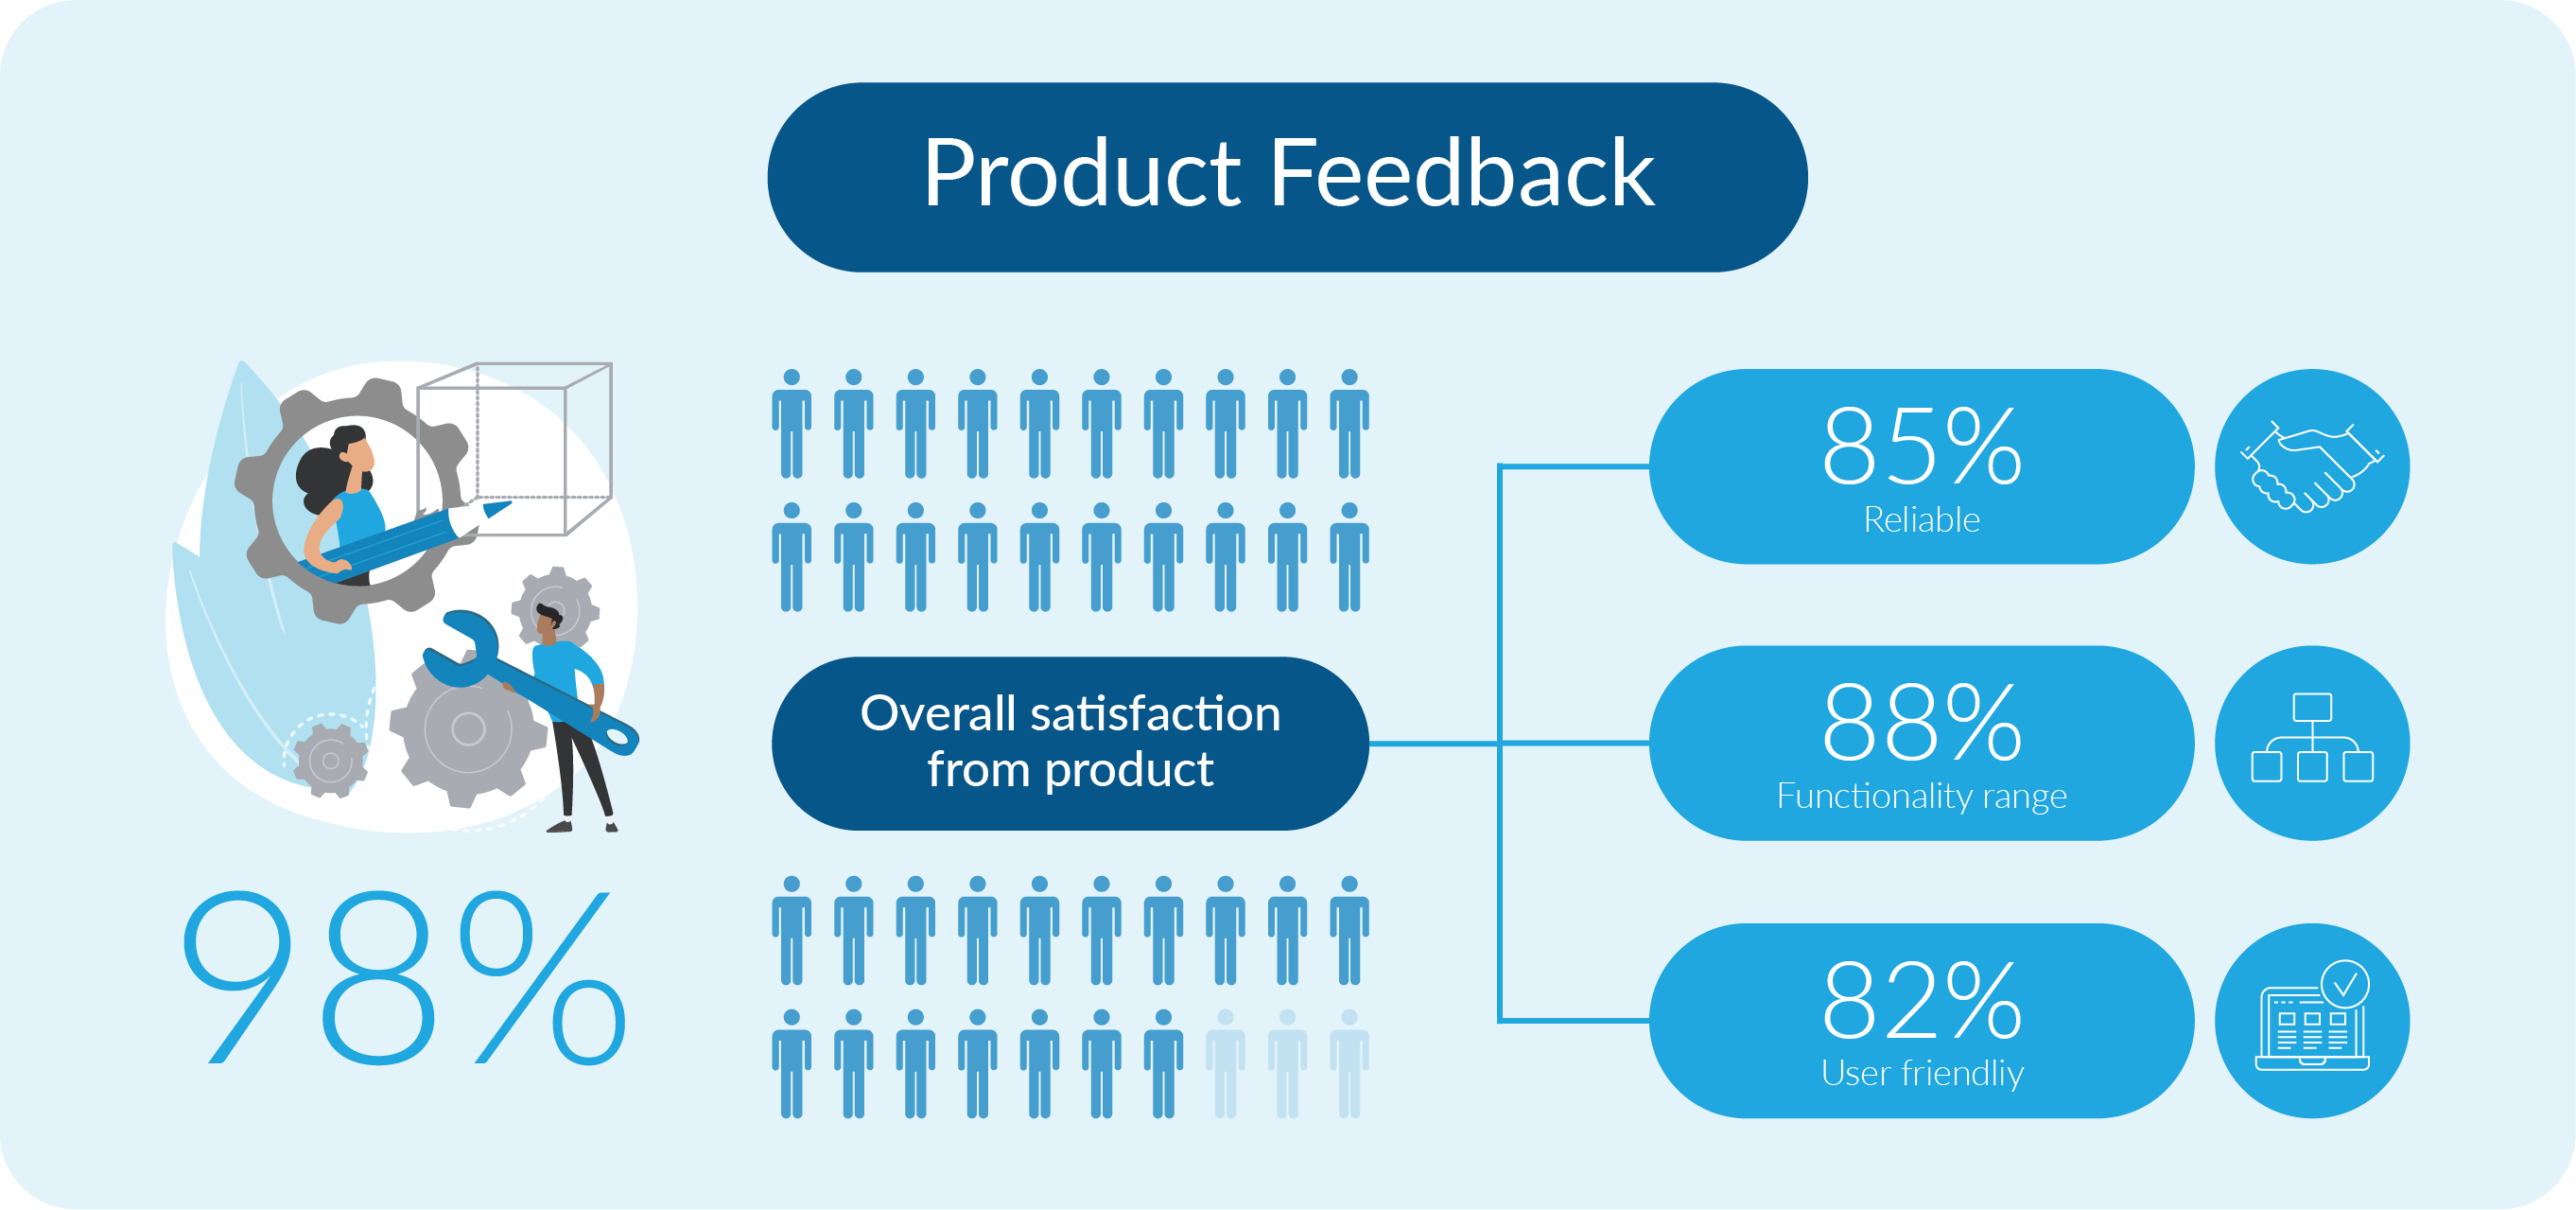
C- Data representing Product survey results in infographic form:
By selecting the correct infographics, data graphs, and charts, you can tell a story with your survey results. This will be engaging and make it easy for the stakeholders to grasp key insights and make informed decisions.
When presenting survey results, common mistakes can undermine the effectiveness of your presentation. Awareness of these pitfalls can help you deliver more impactful and professional results. Here are some critical mistakes to avoid:
A supporting survey report can provide complete details that complement the main presentation. Since not all your data and analysis can be included in your presentation, you can create additional reports for your stakeholder’s reference. This document would provide:
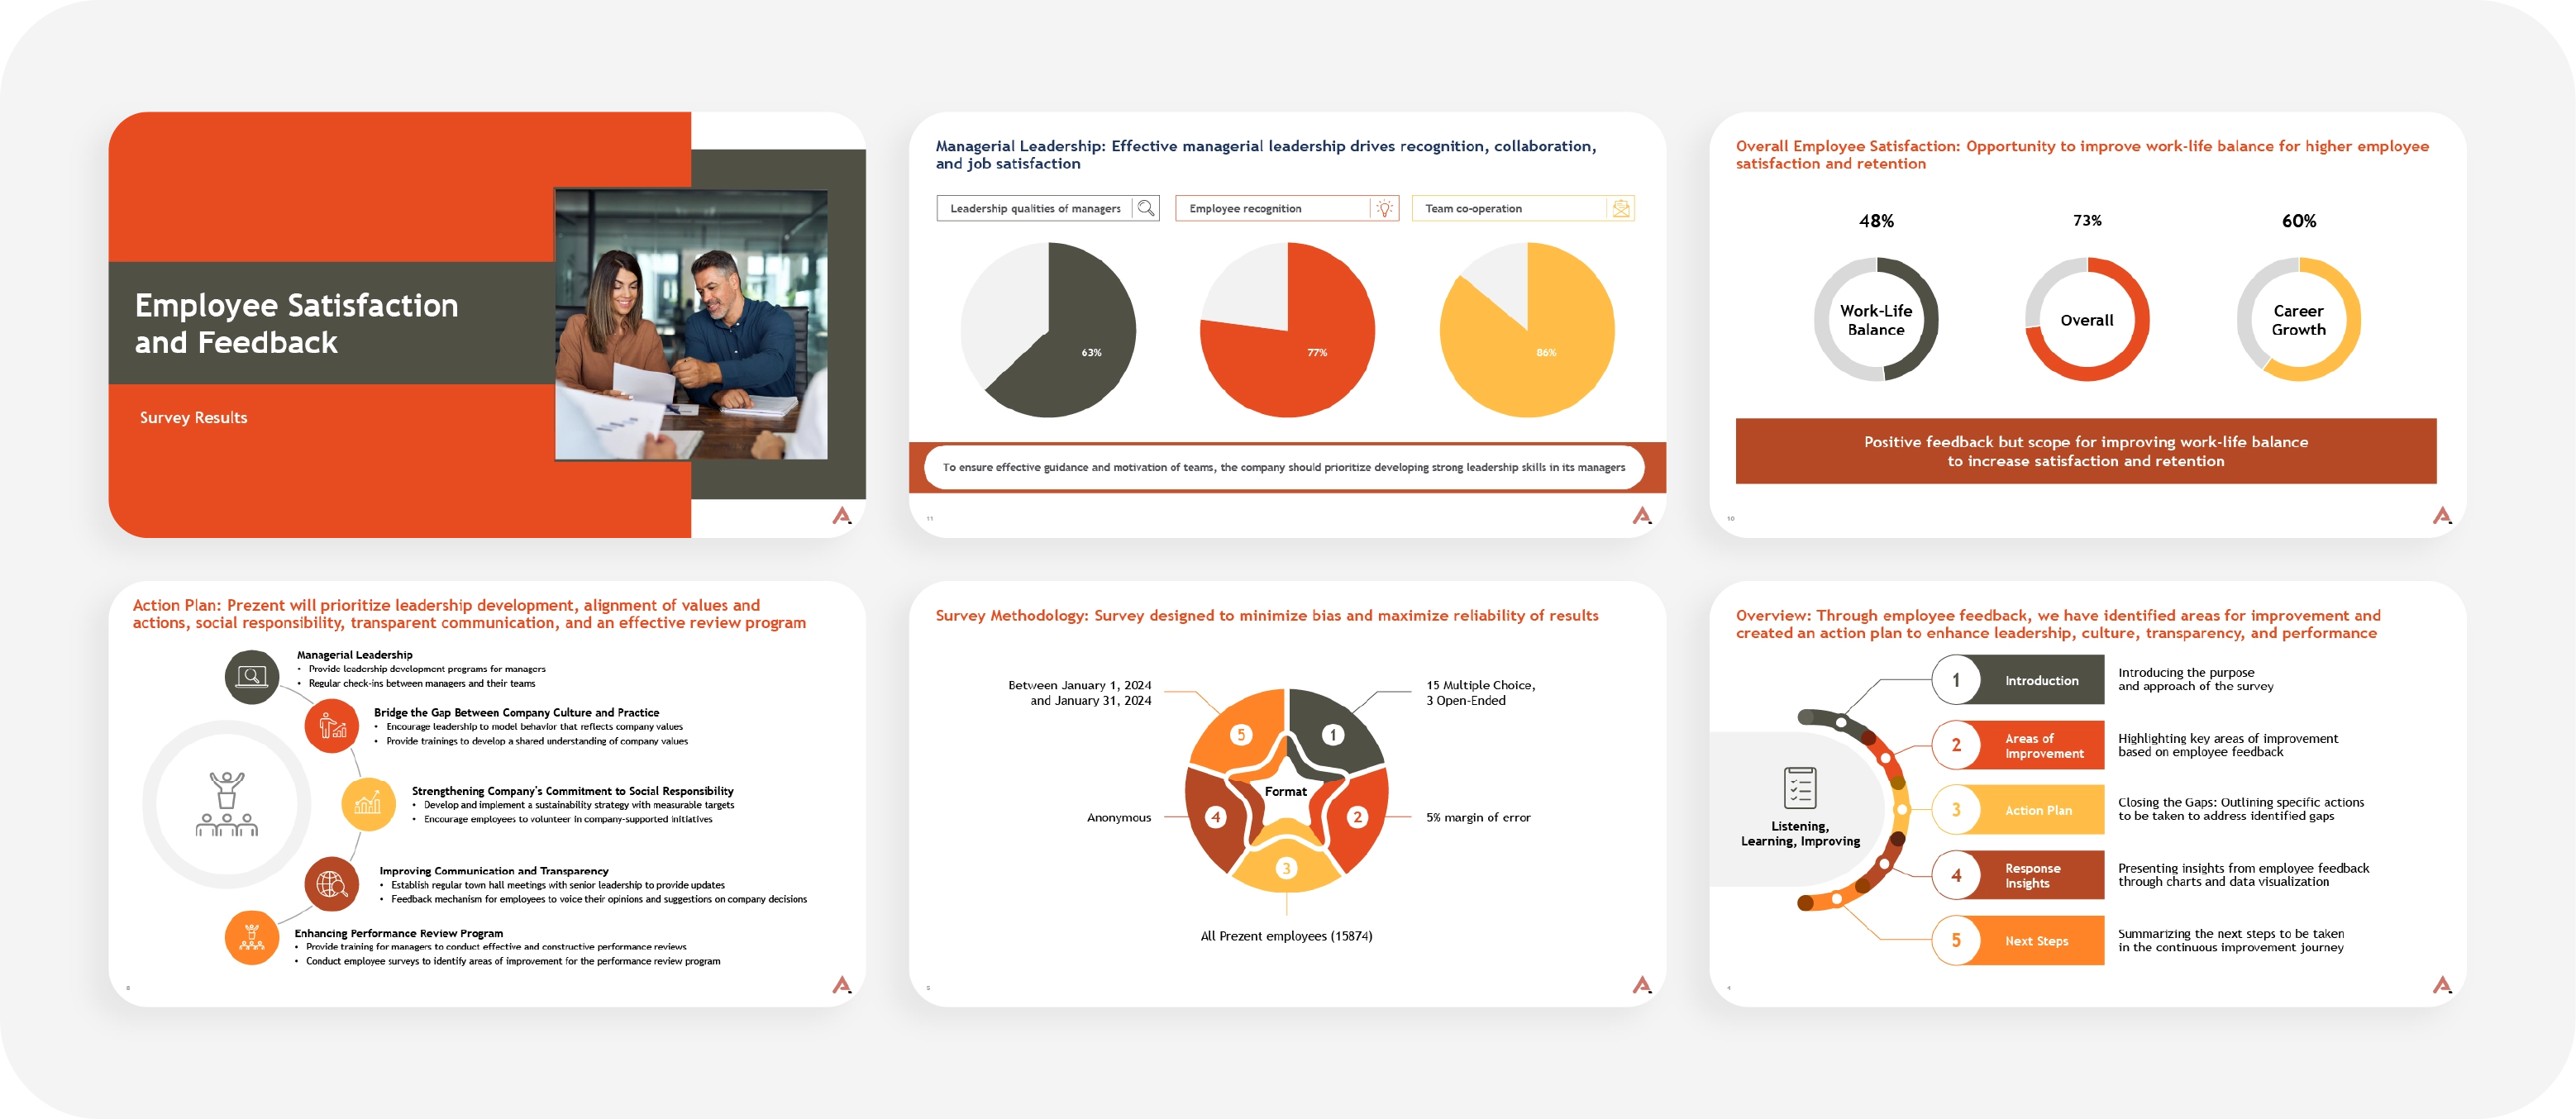
Effectively communicating survey results is essential for organizations to make informed decisions and improve based on feedback. A clear and well-structured presentation is critical to conveying survey findings persuasively.
Below is an example of a professionally designed survey result PowerPoint template that visually presents survey data using charts, graphs, and tables. This template was created with best practices in mind, ensuring clarity and supporting informed decision-making. It helps enhance organizational effectiveness and performance based on survey feedback.
Prezent is an AI-powered business communication platform equipped with powerful features to help you build impactful and visually appealing survey result presentations in 50% less time. Here’s how Prezent can enhance your presentation:
Discover more exciting features of Prezent AI by scheduling a demo with our experts. Learn how Prezent can help you create compelling presentations quickly and efficiently, allowing you to focus on your core tasks. Alternatively, explore the platform yourself with a free trial.